

Major platforms like Facebook and Twitter have recognized this and even made an active push to show video over other types of content to drive engagements and keep users onsite longer. Doesn’t this sound like the type of content you want to be sharing?
Identifying a goal for your video content is step one.
If your brand is producing video content, it’s important to make sure you are prepared to measure the return on your investment (ROI)—whether that is in the form of reach, traffic, or sales is up to you. Having a clear goal in mind can make a tremendous difference in the direction and success of your content.
Metrics can help you understand how your videos perform. But you have to understand the metrics first.
Whether you are running a paid advertisement or just publishing to your feed, measuring the success of your video content on social media is made easy with detailed metrics. However, not all platforms handle video metrics the same way. It’s important to understand the subtle differences if you are managing your brand’s presence on multiple platforms.
Facebook Video Metrics
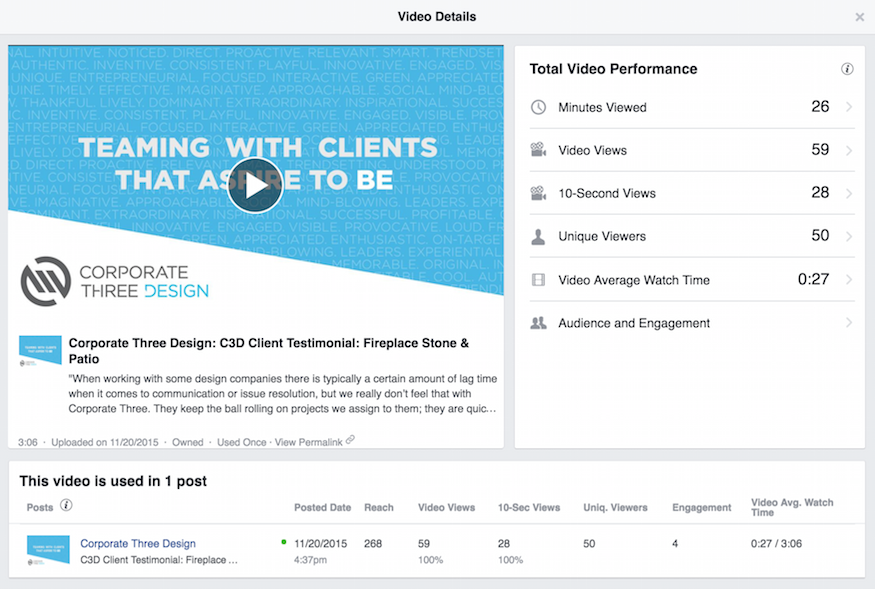
Video has exploded on Facebook.
This is partly due to its auto-play feature but also because brands are simply creating and producing more of it. Understanding the platform-specific nature of Facebook’s video metrics can help your brand produce the best video content possible on Facebook.
Video Retention
Facebook’s audience retention graph shows your audience’s interest over time. This section also includes data like average view duration, total video views for the first 28 days and the number of people who watched your video for at least 30 seconds.
Facebook’s definition of what constitutes a video “view” has garnered some criticism from the advertising community. If a user watches a video for at least 3 seconds, this is counted as a view.

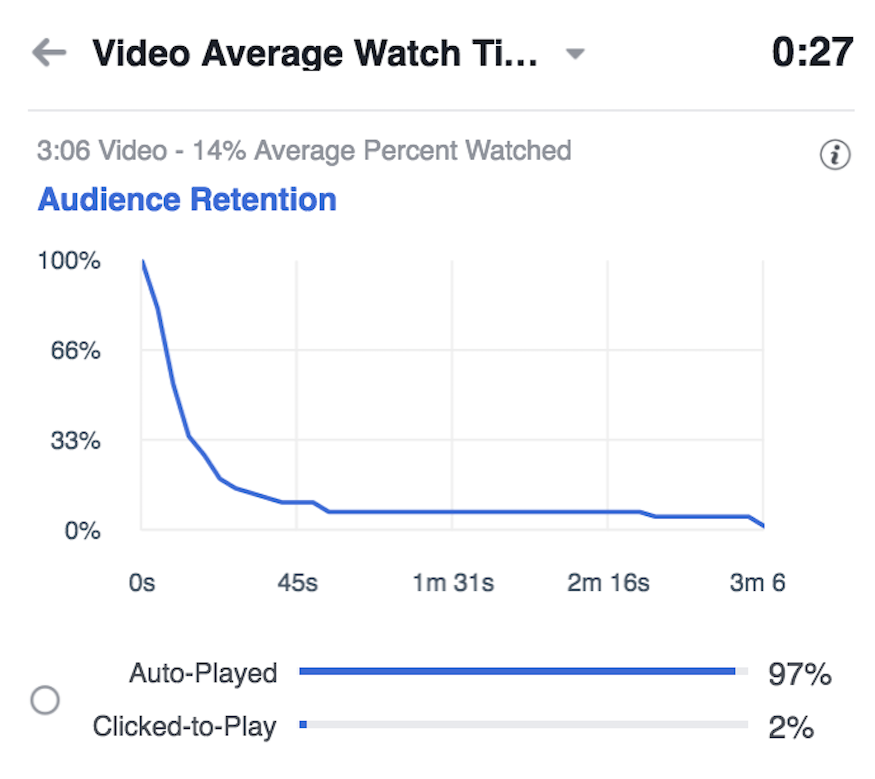
When you consider how easy it is to stumble onto a video in your news feed that automatically plays for a few seconds, especially on mobile, you can begin to understand marketers’ frustrations with how this metric is defined.
Don’t be fooled by inflated view counts. Look for more meaningful metrics like engagement and clicks to understand the true value of your video content.
Video Engagement
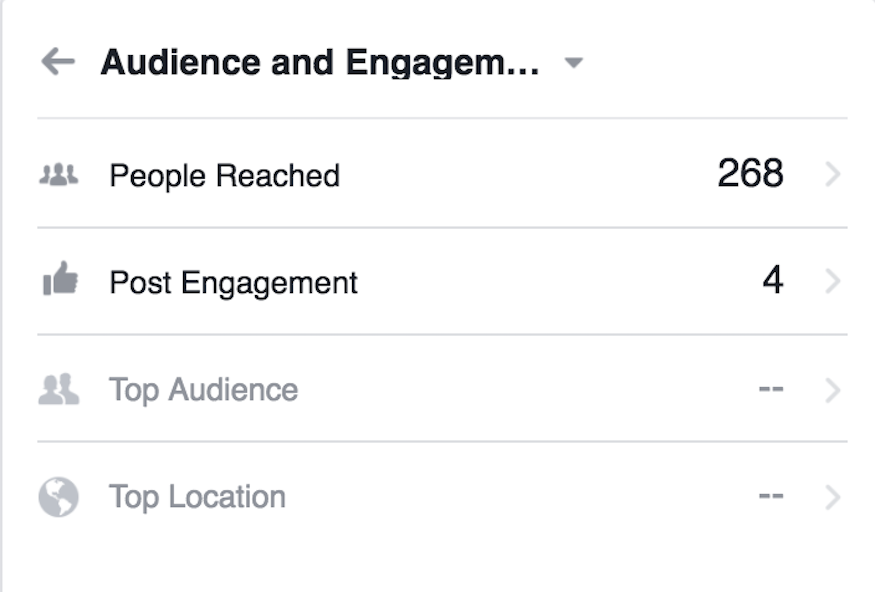
Facebook admits that engagement is typically the best measure of how much your video resonates with your audience. This section includes the video’s 28-day breakdown of all likes, comments, and shares on the original post.
Clicks on your Video
Facebook also provides metrics about user engagement with your video post. Click data is divided into three categories:
- Clicks to Play: How many times a video started after someone clicked it.
- Link Clicks: How many times someone clicked a link in a post to a video.
- Other Clicks: How many times someone clicked other elements of a post (Page title, “See More”, or a CTA).
Learn more about Facebook Page Insights
Twitter Video Metrics
In recent years, Twitter has made a big push to provide users and brands with more data about the content they are sharing and the ads they are paying for. With the rollout of the Tweet Activity Dashboard, you can now evaluate metrics in real-time and for all your tweets dating back to October 2013.
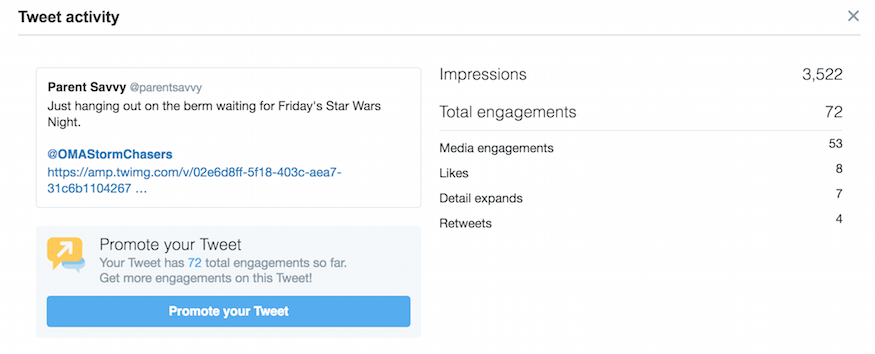
While not as segmented as the Page Insights data on Facebook, Twitter still offers some basic measurements that can help gauge the engagement of your video content. Twitter’s metrics for video content do not offer much more insight than the metrics you will see for a basic tweet, but here is a look at the kind of data that is available to you:
- Views: Counted when a video is 100% in-view on the user’s device, and has been watched for at least 3 seconds.
- Detail expands: Clicks on the Tweet to view more details
- Embedded media clicks: Clicks to view a photo or video in the Tweet
- Engagements: Total number of times a user interacted with a Tweet (Clicks anywhere on the Tweet).
- Engagement rate: Number of engagements divided by impressions
- Follows: Times a user followed you directly from the Tweet
- Hashtag clicks: Clicks on hashtag(s) in the Tweet
- Impressions: Times a user is served a Tweet in timeline or search results
- Leads submitted: Times a user submitted his/her info via Lead Generation Card in the Tweet
- Likes: Times a user liked the Tweet
- Link clicks: Clicks on a URL or Card in the Tweet
- Permalink clicks: Clicks on the Tweet permalink (desktop only)
- Replies: Times a user replied to the Tweet
- Retweets: Times a user retweeted the Tweet
- Shared via email: Times a user emailed the Tweet to someone
- User profile clicks: Clicks on the name, @handle, or profile photo of the Tweet author
YouTube Video Metrics
As the second largest search engine on the internet, YouTube serves video content to a diverse audience of over one billion children and adults.
YouTube boasts a number of design features that Facebook does not, although the platforms are starting to function more and more like each other each day with the introduction of video playlists and live video on Facebook.
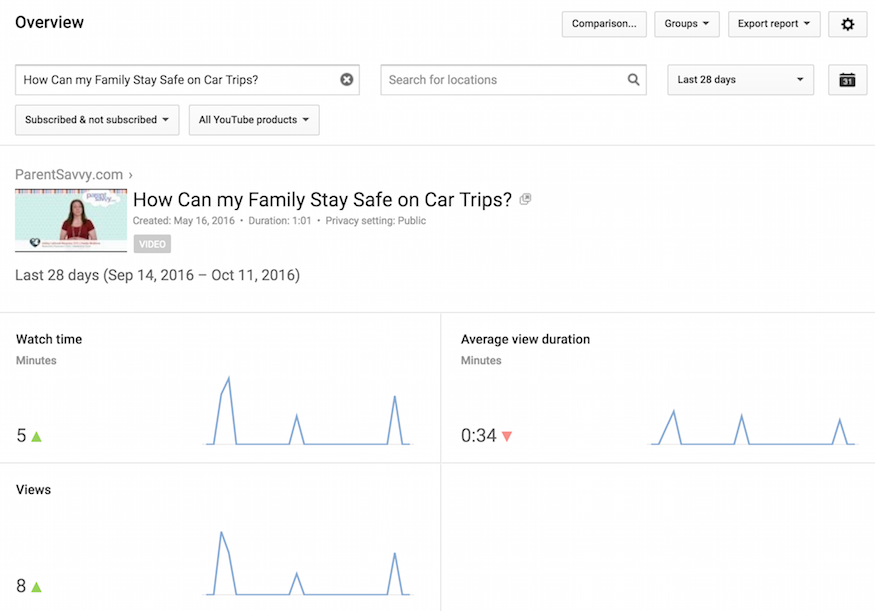
As a general rule of thumb, we advise our clients to publish video content to both Facebook and YouTube for a greater reach and to broaden that target audience. Look for these core metrics when analyzing the results of your video content on YouTube:
View & Watch Time metrics
- Views: The number of times that a video was viewed. In a playlist report, the metric indicates the number of times that a video was viewed in the context of a playlist. Views of any duration are counted until the viewcount reaches 300. From 301, only views lasting “about 30 seconds” are counted.
- Estimated Minutes Watched: The number of minutes that users watched videos for the specified channel, content owner, video, or playlist.
- Average View Duration: The average length, in seconds, of video playbacks. In a playlist report, the metric indicates the average length, in seconds, of video playbacks that occurred in the context of a playlist.
Engagement metrics
- Comments: The number of times that users commented on a video. See the YouTube Help Center for more information.
- Likes: The number of times that users indicated that they liked a video by giving it a positive rating.
- Dislikes: The number of times that users indicated that they disliked a video by giving it a negative rating.
- Shares: The number of times that users shared a video through the Share button. See the YouTube Help Center for more information.
- Subscribers Gained: The number of times that users subscribed to a channel.
- Subscribers Lost: The number of times that users unsubscribed from a channel.
Annotations metrics
- Annotation Close Rate: The ratio of annotations that viewers closed to the total number of annotation impressions.
- Annotation Click-Through Rate (CTR): The ratio of annotations that viewers clicked to the total number of clickable annotation impressions.
Looking for new ways to connect with your audience online? Improve your brand’s reach on social media to increase site traffic and grow your business!